A luxury hotel looks like a hospitality business. Financially, it often behaves like a highly leveraged real-estate vehicle whose room rates cannot cover the cost of building it. This paper walks through that structural gap, the fee and risk split between brand and owner, the rigidity of operating costs, and the cash-flow engines that actually keep the model alive.
Figures below are illustrative models calibrated to publicly cited industry ranges. Two data sources matter throughout:
- HVS (Hotel Valuation Services) is a global hospitality consulting and appraisal firm. Its development-cost surveys are a standard reference for how much hotels cost to build per room (“per key”) across hotel types.
- STR / CoStar is the industry’s main hotel-performance data platform (STR, formerly Smith Travel Research, is part of CoStar Group). It publishes the benchmarks operators and owners use for ADR (average daily rate, the average price earned per occupied room), plus occupancy and RevPAR.
Those sources put luxury development-cost medians above $1M/key (with many gateway projects above $2M/key) and US luxury ADR near $394.
1. The gap between capital intensity and returns
Construction costs. In prime locations, building a luxury hotel runs roughly $1 to $2 million per key. A 200-room property therefore costs $200 to $400 million, typically financed largely with debt at 6 to 8% interest. Simpler hotel types cost far less to build.
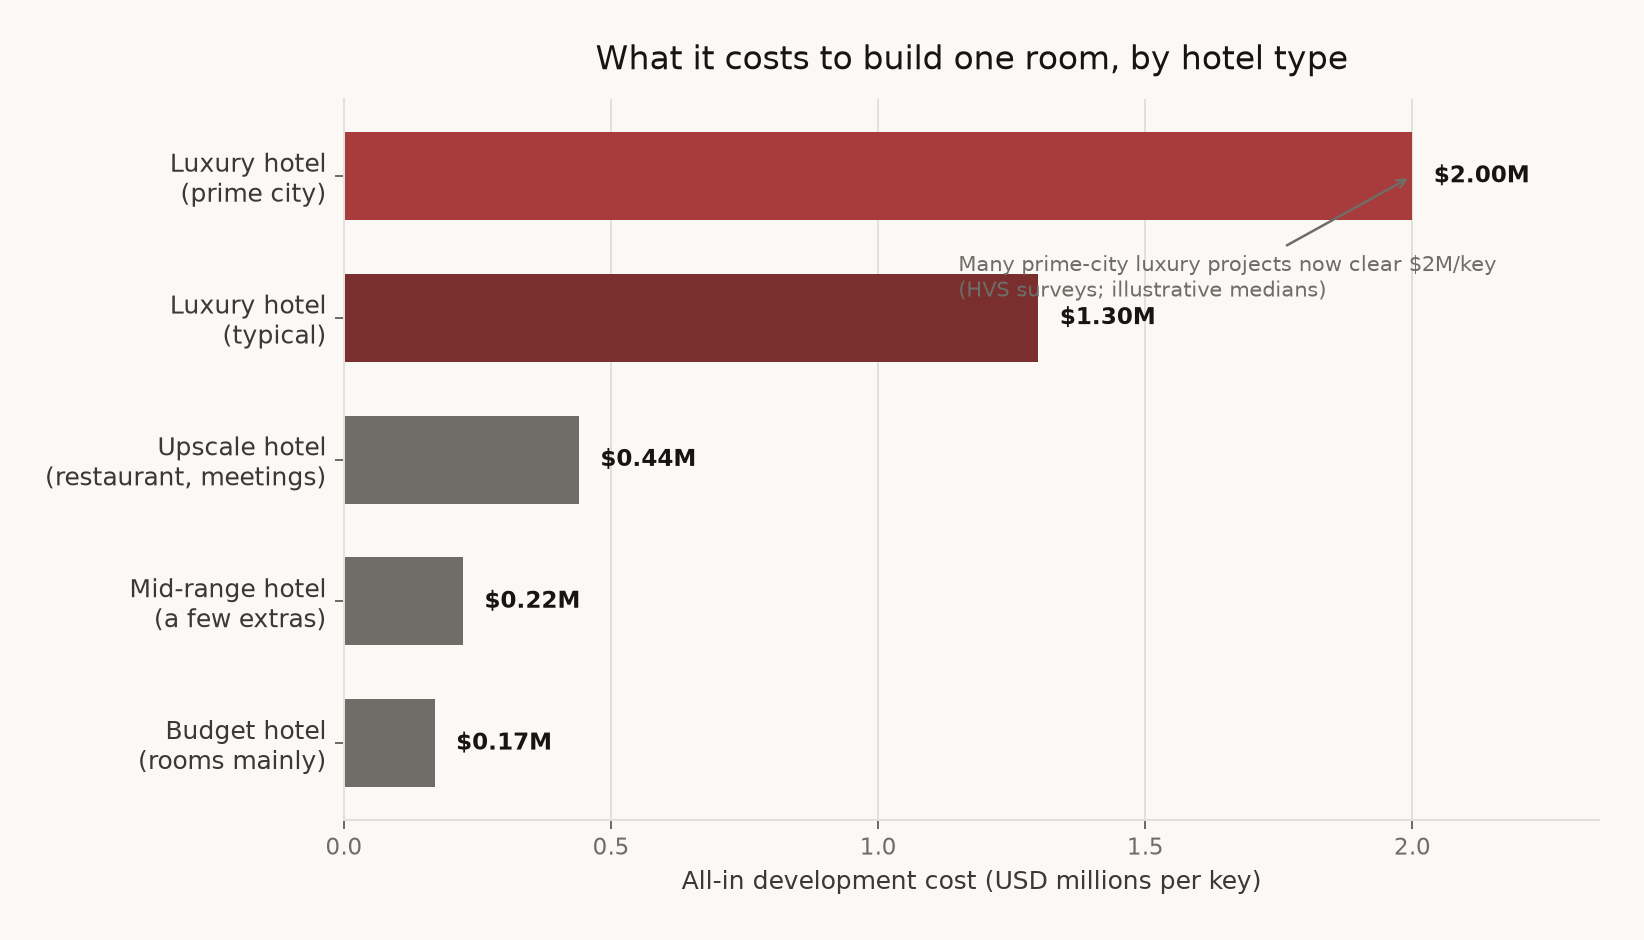
Figure 1. Illustrative all-in development cost per room. Budget and mid-range hotels cluster near $0.2M/room; an upscale hotel with restaurant and meeting space is around $0.4M; a typical luxury hotel clears $1M, and prime-city luxury projects often reach $2M.
The 1:1000 rule. For every $1,000 invested in building one room, the hotel must sustainably charge about $1 in ADR at ~65% occupancy just to cover costs. This is a long-standing industry rule of thumb (also discussed in HVS valuation guidance), not a precise appraisal model.
Market reality. A cost of $1 million per room implies a stable ADR near $1,000. STR/CoStar-style averages for US luxury hotels land closer to $394. From day one, the standalone hotel model is structurally loss-making, which is why developers surround the hotel with luxury residential units that subsidize it.
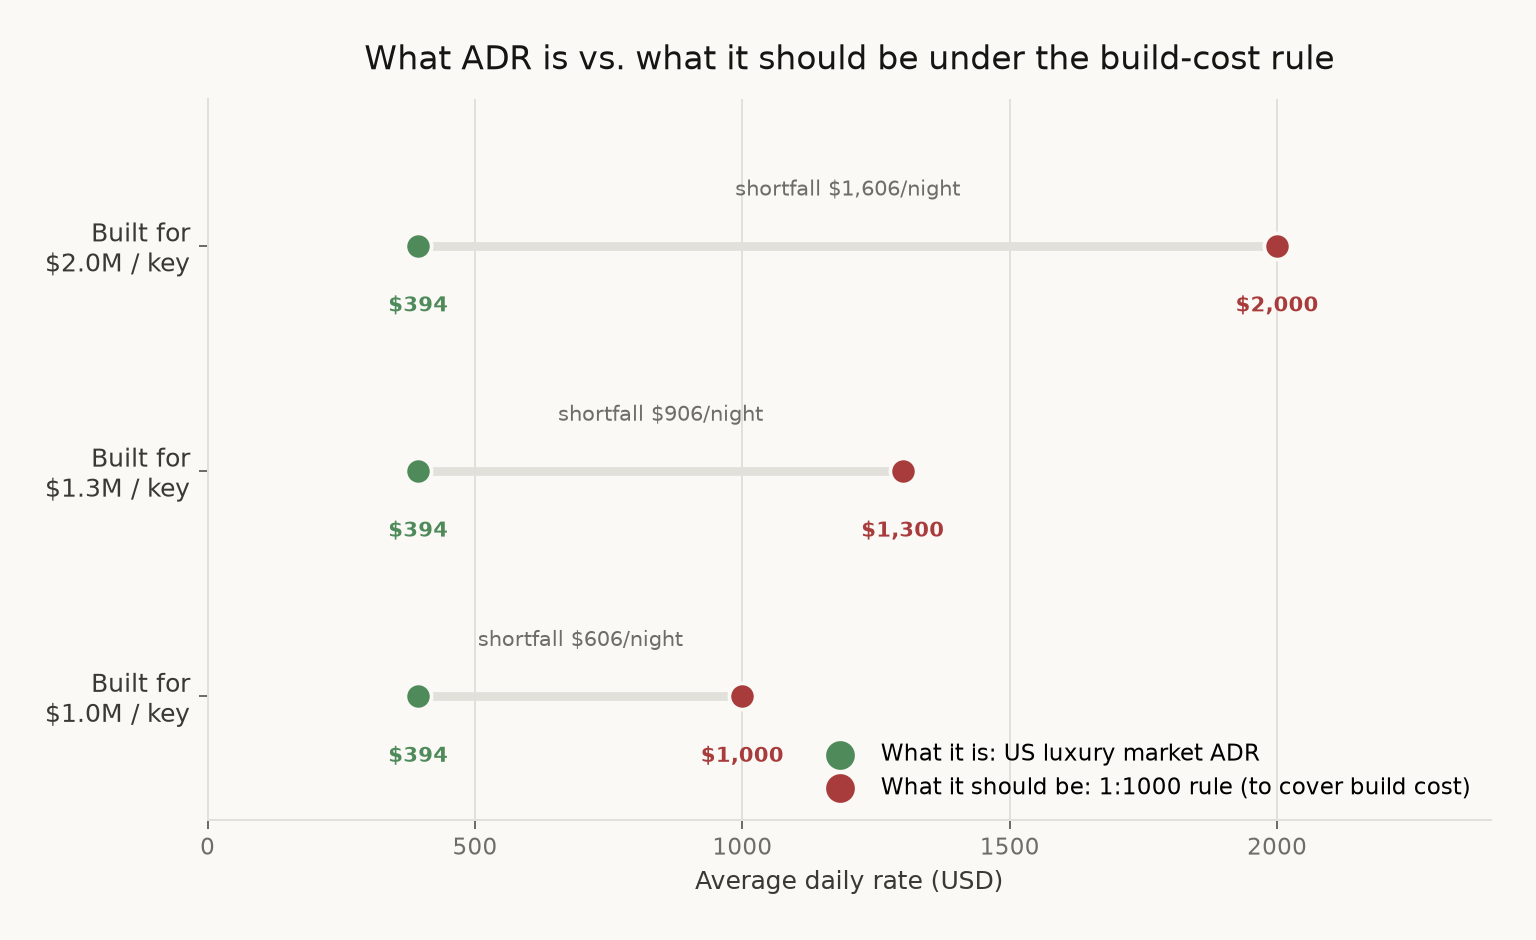
Figure 2. Each row is the same US luxury market ADR (~$394), what guests actually pay on average, against the ADR the 1:1000 rule says you need at that build cost ($1,000 / $1,300 / $2,000). The line between them is the shortfall: reality stays flat while the “should be” rate rises with construction cost.
2. Risk asymmetry: owner vs. operator
Separation of ownership. Brands such as Marriott, Hilton, and Hyatt typically do not own the buildings. Assets sit with sovereign wealth funds, REITs, or private equity.
Fee stack before profit. The operator (the brand) takes 10 to 15% of gross revenue through base fees, licensing, marketing, and loyalty programs. Those amounts are skimmed before operating profit is calculated.
Who bears the downside. The property owner carries 100% of operating risk, payroll, and debt service. The brand collects its fees whether the hotel makes a profit or a loss.
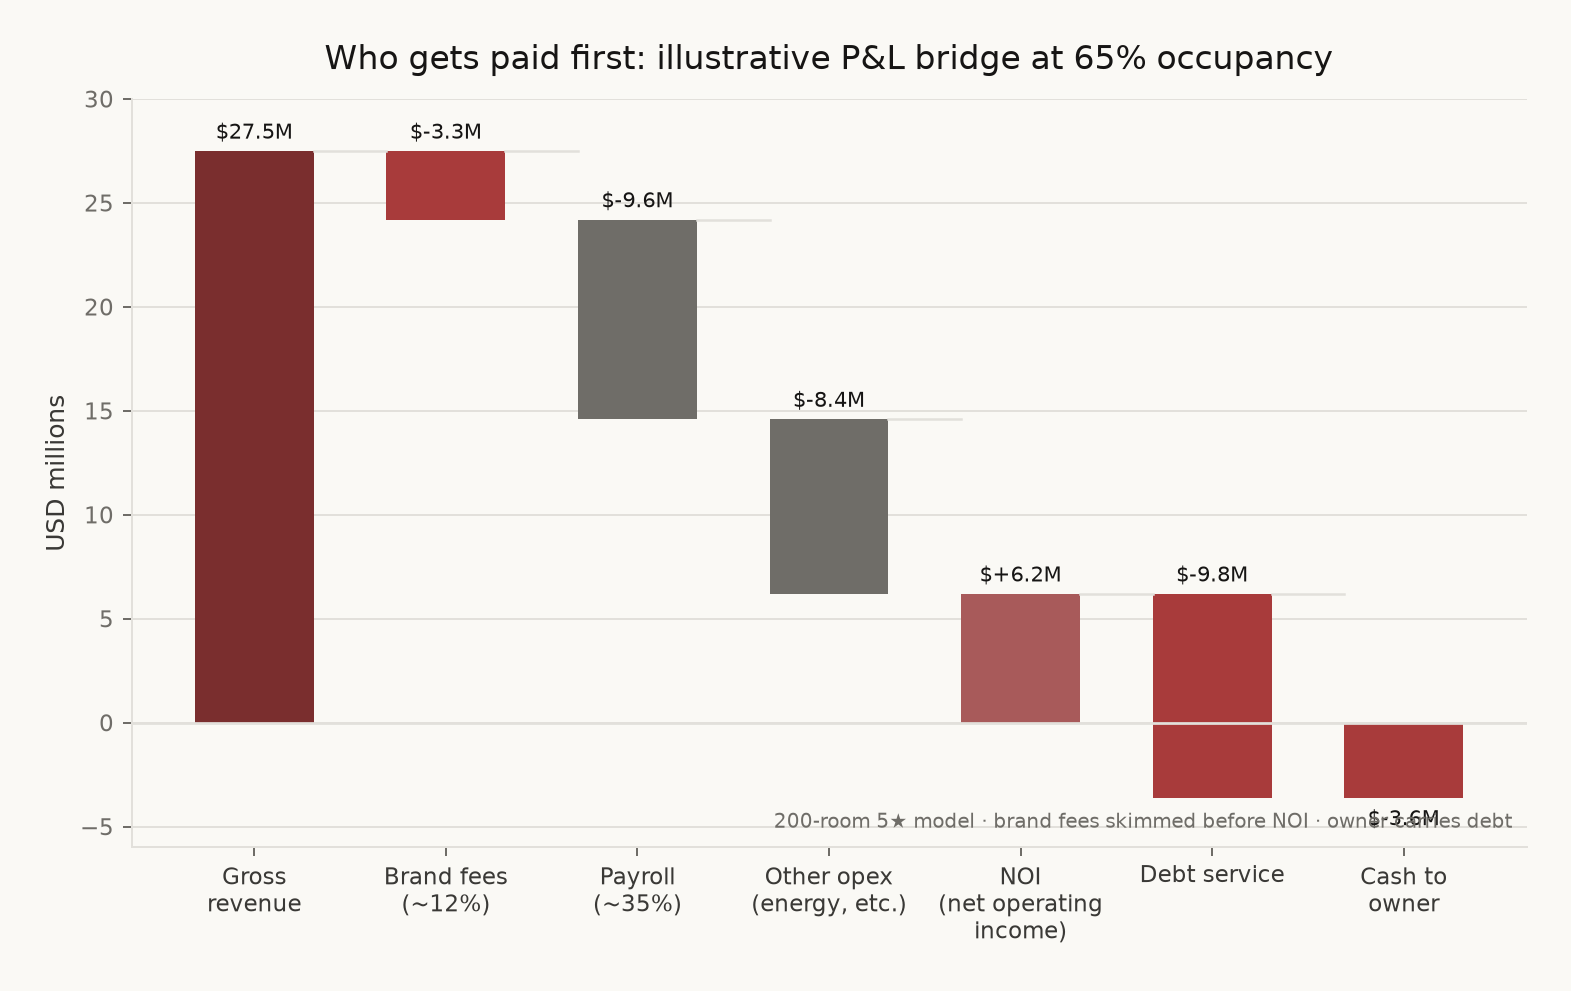
Figure 3. Waterfall for an illustrative 200-room 5★ hotel at 65% occupancy. Brand fees leave first; payroll and energy-heavy opex follow; NOI (net operating income) turns positive, then fixed debt service pushes cash to the owner back below zero.
3. Cost rigidity and operating leverage
Labor. Wages typically absorb 32 to 38% of gross revenue. Luxury standards require about 1.5 to 3 employees per room, versus roughly 0.5 in budget hotels.
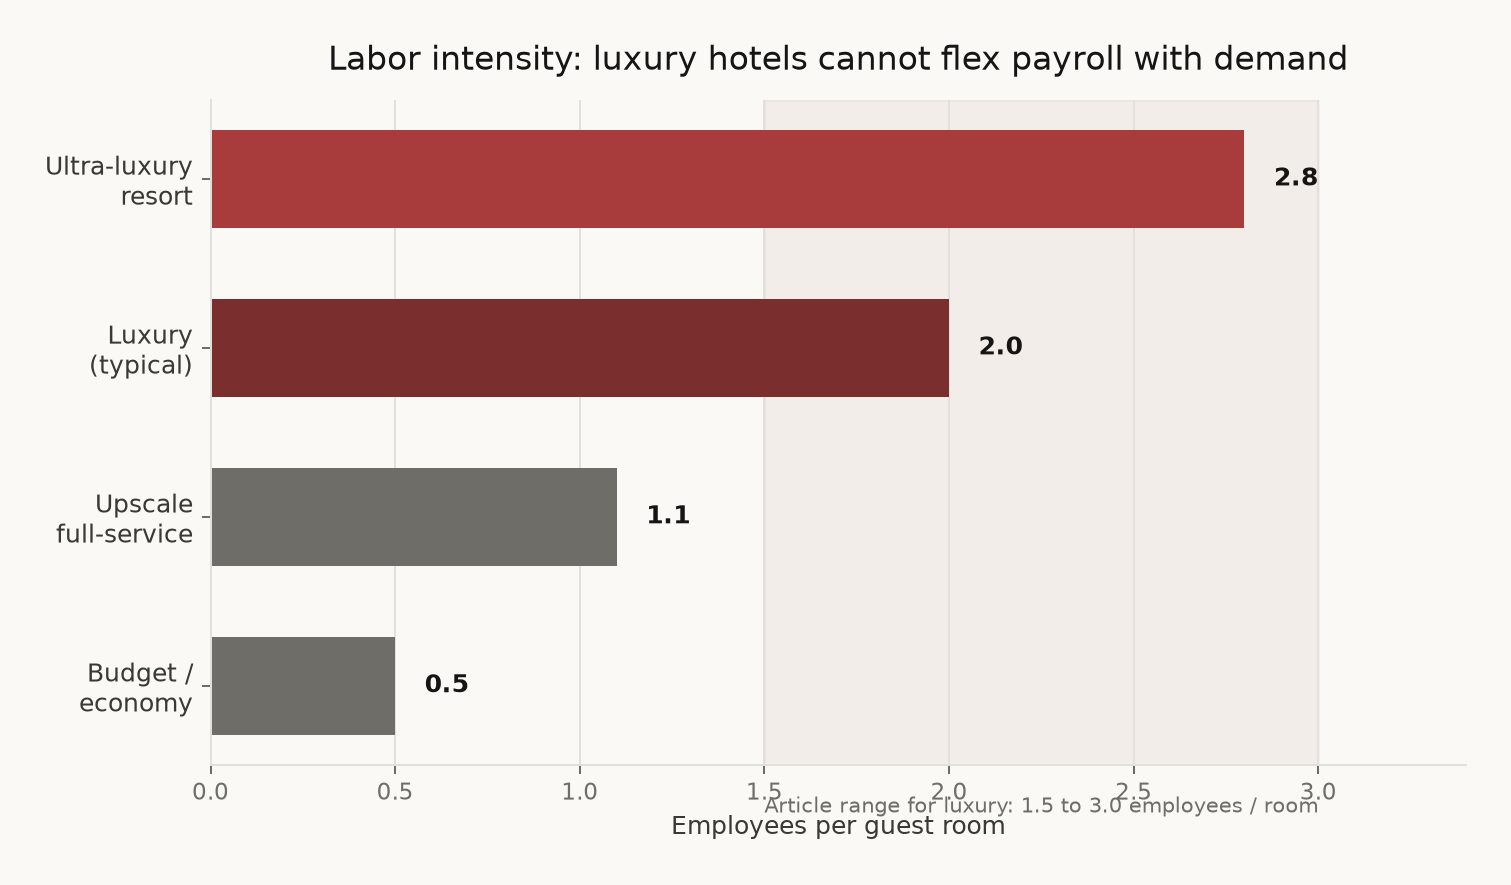
Figure 4. Staffing intensity rises sharply with service level. Luxury cannot shed labor in proportion to a soft night; payroll behaves like a fixed cost.
Energy. Pools, high-performance HVAC, and round-the-clock amenities create a large fixed load. Costs do not fall in line with occupancy.
Absolute perishability. Rooms cannot be inventoried. An unsold room at midnight is permanent revenue destruction for that night. Combined with fixed costs and volatile demand, a drop in occupancy does not trim profit proportionally; it can wipe it out immediately.
4. Financial model: a 200-room five-star hotel
The surface below maps cash to the owner across occupancy and ADR for the same illustrative capital structure (brand fees ~12%, high fixed opex, debt service $9.8M). Green is cash-positive; red is cash-negative. The black contour is the owner break-even frontier.
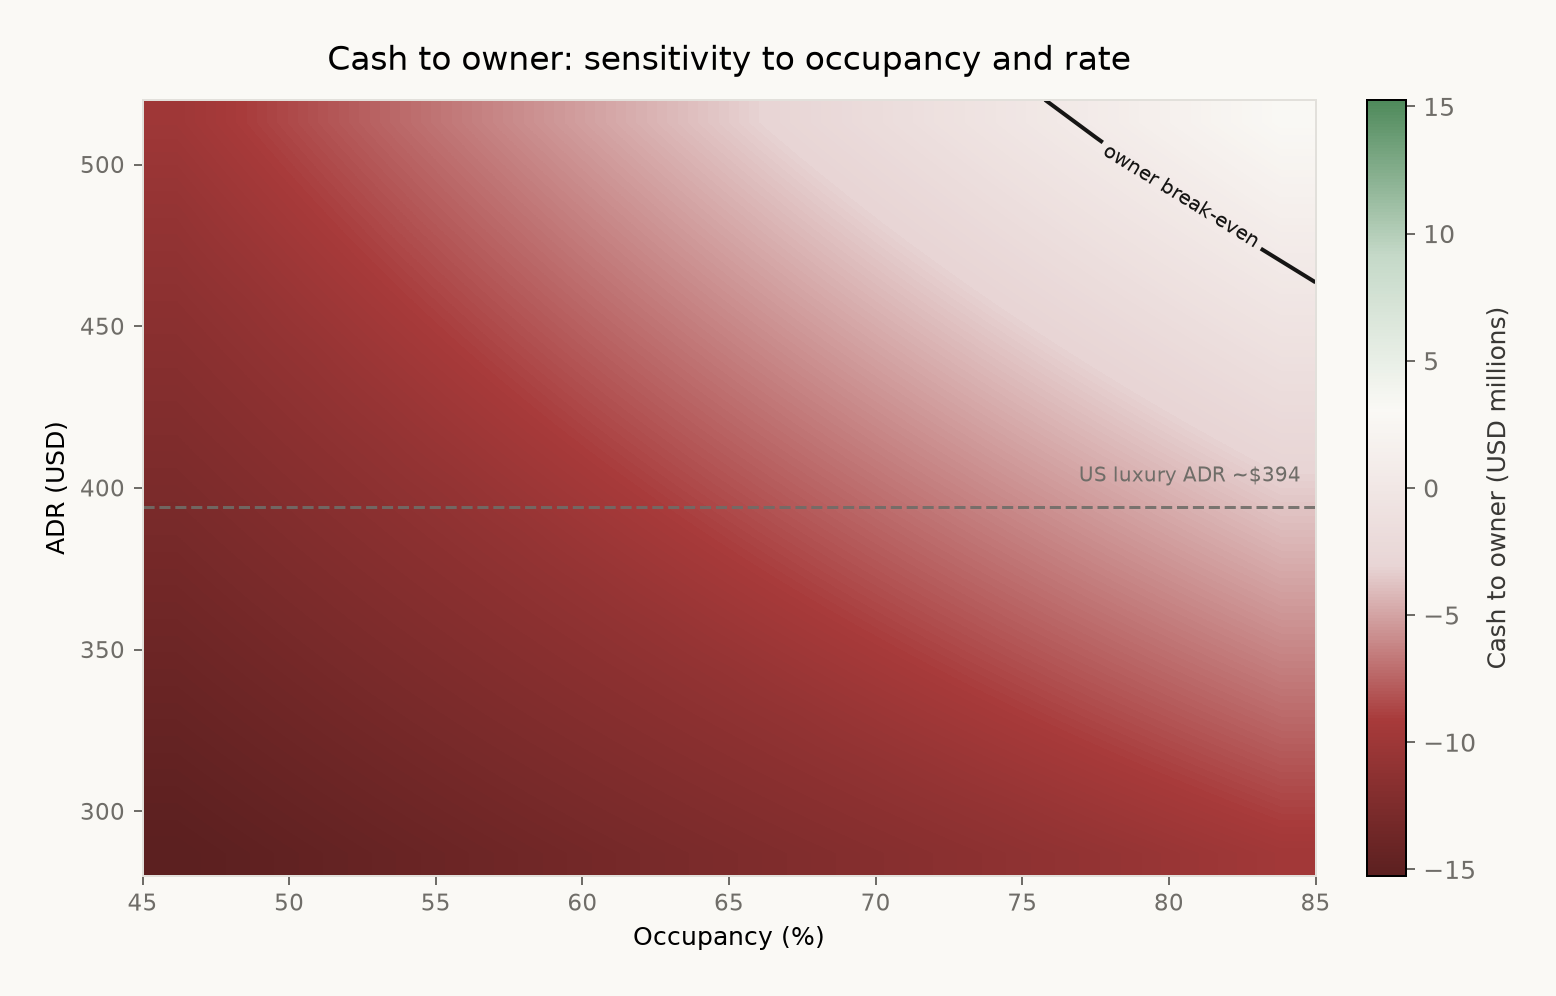
Figure 5. At the US luxury ADR benchmark (~$394), the owner only approaches break-even at very high occupancy. Raising rate helps, but even $450 to $500 ADR still demands mid-to-high-70s occupancy in this leverage structure. That is operating leverage in two dimensions.
5. The real value generators
Tax optimization (cost segregation). Engineering tax studies let investors accelerate depreciation of hotel FF&E over roughly 5 to 7 years, generating large deductions that shelter cash from the owner's other businesses.
B2B demand. Corporate events, conferences, and weddings produce contracted, relatively predictable cash flow months ahead, a buffer against room-night volatility.
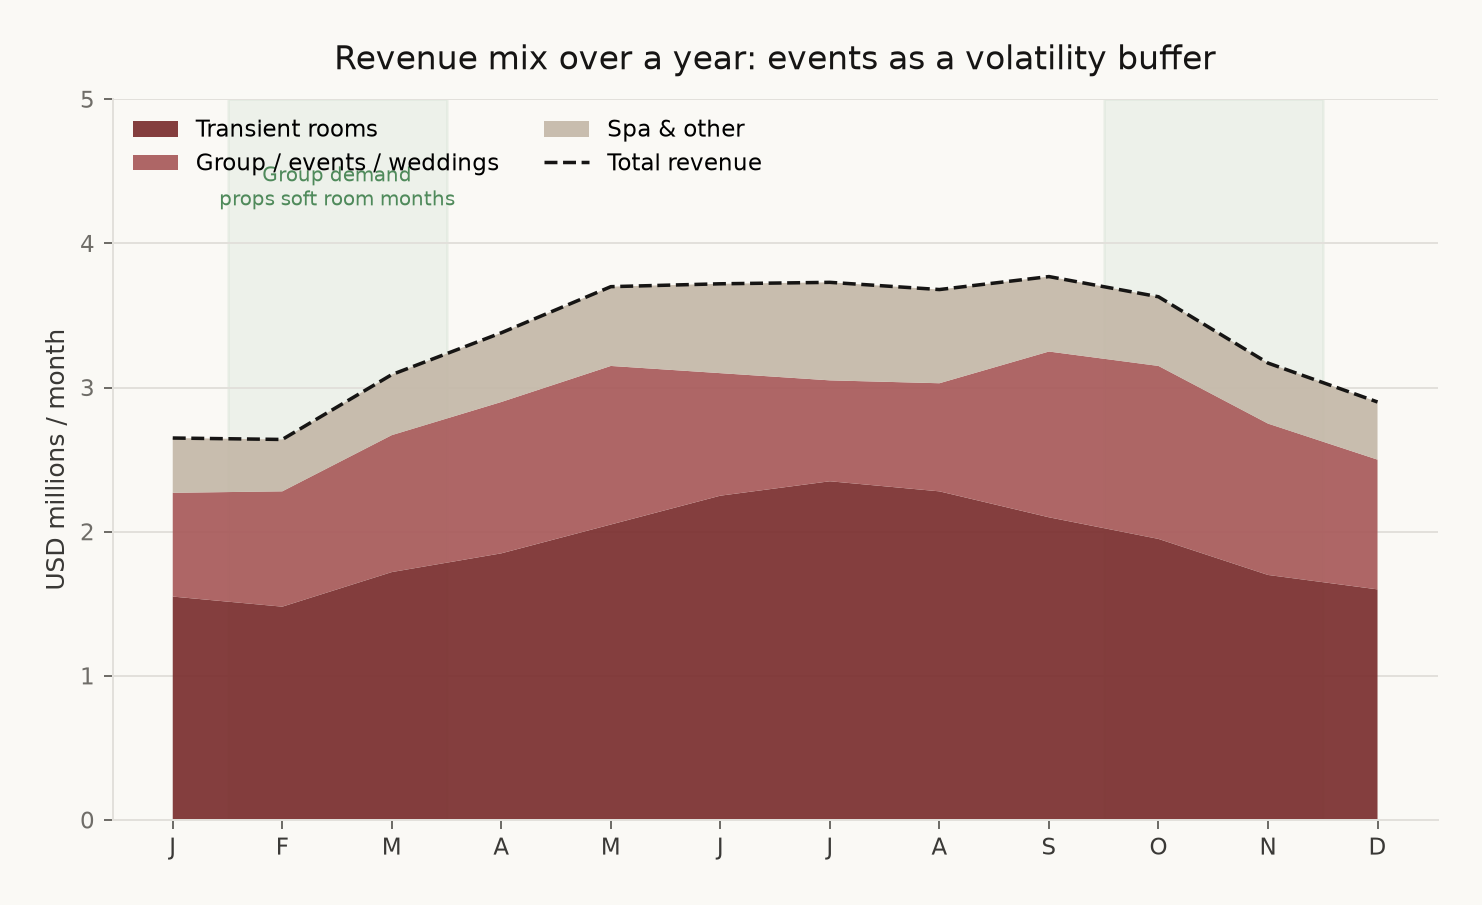
Figure 6. Stacked monthly mix for an illustrative property. Transient rooms swing with seasonality; group/events and spa fill troughs, especially in shoulder months, so total revenue is less volatile than rooms alone.
Presidential suites as loss leaders. Ultra-expensive suites are rarely about selling nights. They function as PR instruments: VIP presence elevates brand perception and helps justify high rack rates on standard rooms for ordinary guests.
Conclusion
A luxury hotel is often less a pure lodging P&L than a brand, tax, and events platform attached to expensive real estate. Room economics alone rarely clear the capital cost; residential cross-subsidy, operator fees that protect the brand, and non-room cash flows are what close the gap for owners who can afford to carry the risk.